本文最后更新于 2025年10月5日 上午
参考:https://juejin.cn/post/6844903953788829704 https://juejin.cn/post/7219669812158414903 https://juejin.cn/post/7223280402475089978
一个页面性能差的话会大大影响用户体验。用户打开页面等待的太久,可能会直接关掉页面甚至不再使用,这种情况在移动端更加明显,移动端用户对页面响应延迟容忍度很低。
虽然页面性能很重要,但是在实际使用中,页面性能差的情况并不少见。首先,在产品的迭代演进过程中,页面性能可能会被忽略,性能随着版本迭代而有所衰减;其次,性能优化是一项复杂而挑战的事情,需要明确的优化方向和具体的优化手段才能快速落地取效。
所以需要一个性能监控系统,持续监控和预警页面性能的状况,并且在发现瓶颈时指导优化工作。
监控方面 性能监控 用于收集页面加载和渲染的相关性能指标。
页面整体:
起始点、首字节、白屏时间、首屏时间
DOMContentLoaded 时间、load 时间
用户体验:
FCP(First Contentful Paint):首次内容绘制
LCP(Largest Contentful Paint):最大内容绘制
FID(First Input Delay):首次输入延迟
CLS(Cumulative Layout Shift):页面抖动
TBT(Total Blocking Time):阻塞总时长,表示页面加载过程所有长任务阻塞主线程的总时间。它也可以通过监听页面上的长任务来计算。当一个长任务的执行时间超过 50 毫秒时,我们认为它阻塞了主线程
TTI(Time to Interactive):可交互时间,从用户发起请求到页面可以正常响应用户操作所经过的时间。这个指标反映了用户等待页面可交互的时间,对用户体验有很大影响
资源监控 用于监控页面中各种资源(例如图片、脚本、样式表等)的加载情况,以及它们对页面性能的影响。
HTML、CSS、JS、图片等资源的大小和加载耗时
DNS 解析时间、TCP 建连时间、SSL 握手时间
API 请求耗时、成功率、错误率
DNS 解析时间、TCP 建连时间、SSL 握手时间
运行监控
长任务(Long Task > 50ms)
功耗和内存使用情况(SPA 特别关注内存泄漏)
帧率 FPS(滚动/动画是否卡顿/掉帧)
异常监控
JS 报错(window.onerror、unhandledrejection)
资源加载错误
接口请求失败
用户行为监控 用于收集用户在网站或应用中的操作信息,例如点击、滚动、输入等。
数据采集
调试工具
浏览器控制台 Network(单个资源分析、DOMContentLoaded 时间、load 时间)
浏览器控制台 Lighthouse(FCP、LCP、CLS)
浏览器控制台 Peformance(详细分析性能)
三方测试工具 webPageTest(模拟在不同地区用不同浏览器下的访问性能)
webpack 开启 source-map 和 webpack-bundle-analyzer(资源打包分析)
监控 API
window.performanceweb-vitalsconst observer = new PerformanceObserver((list) => {})window.addEventListener('DOMContentLoaded', (event) => {})window.addEventListener('load', (event) => {})
自定义埋点
API 请求封装:统一拦截、记录请求耗时
用户关键路径打点:比如首屏渲染完成、按钮点击到结果展示
可以根据实际需求定义自定义的埋点数据结构,通常包含:
事件名称 (event): 区分不同类型的事件
事件触发时间 (timestamp): 用来计算事件的触发时长,便于后续分析
页面信息 (page): 当前页面的路径、标题等
用户信息 (user): 比如用户 ID、登录状态、设备信息(这部分需要提前从用户的上下文中提取)
额外数据 (data): 例如按钮文本、输入框内容等
用户行为监控 针对用户点击、滚动、输入、使用 document.addEventListener 进行监控,根据传递参数的不同来监控不同的事件。
1 2 3 4 5 6 7 8 9 10 11 12 13 14 15 16 17 18 19 20 21 22 23 24 25 26 27 28 29 30 31 32 33 34 35 36 37 38 39 40 41 42 43 44 45 46 47 48 49 50 51 52 53 54 55 56 57 58 59 60 61 62 63 64 65 66 67 68 function sendData (data ) document .addEventListener("click" , function (event ) let target = event.target;console .log("我点击了~~" , event);let id = target.id;let className = target.className;let data = {type : "click" ,id : id,className : className,document .addEventListener("scroll" , function (event ) let scrollTop = document .documentElement.scrollTop;let data = {type : "scroll" ,scrollTop : scrollTop,document .addEventListener("input" , function (event ) let target = event.target;let value = target.value;let data = {type : "input" ,value : value,
或者:
1 2 3 4 5 6 7 8 9 10 11 12 13 14 15 16 17 18 19 20 21 22 import React from "react" ;import { trackEvent } from "./track" ; const Button = () => {const handleClick = () => {"button_click" , {buttonText : "Click Me" , buttonId : "btn-123" , page : window .location.pathname, "Button clicked!" );return (<button id ="btn-123" onClick ={handleClick} > Click Me </button > export default Button;
页面浏览埋点 记录用户访问某个页面时的相关信息,如页面路径、页面标题等。
1 2 3 4 5 6 7 8 9 10 11 12 13 14 15 16 17 18 19 20 21 22 import React, { useEffect } from "react" ;import { trackEvent } from "./track" ; const App = () => {() => {"page_view" , {pagePath : window .location.pathname, pageTitle : document .title, return (<div > <h1 > Welcome to My App</h1 > <Button /> {/* 上面定义的按钮组件 */} </div > export default App;
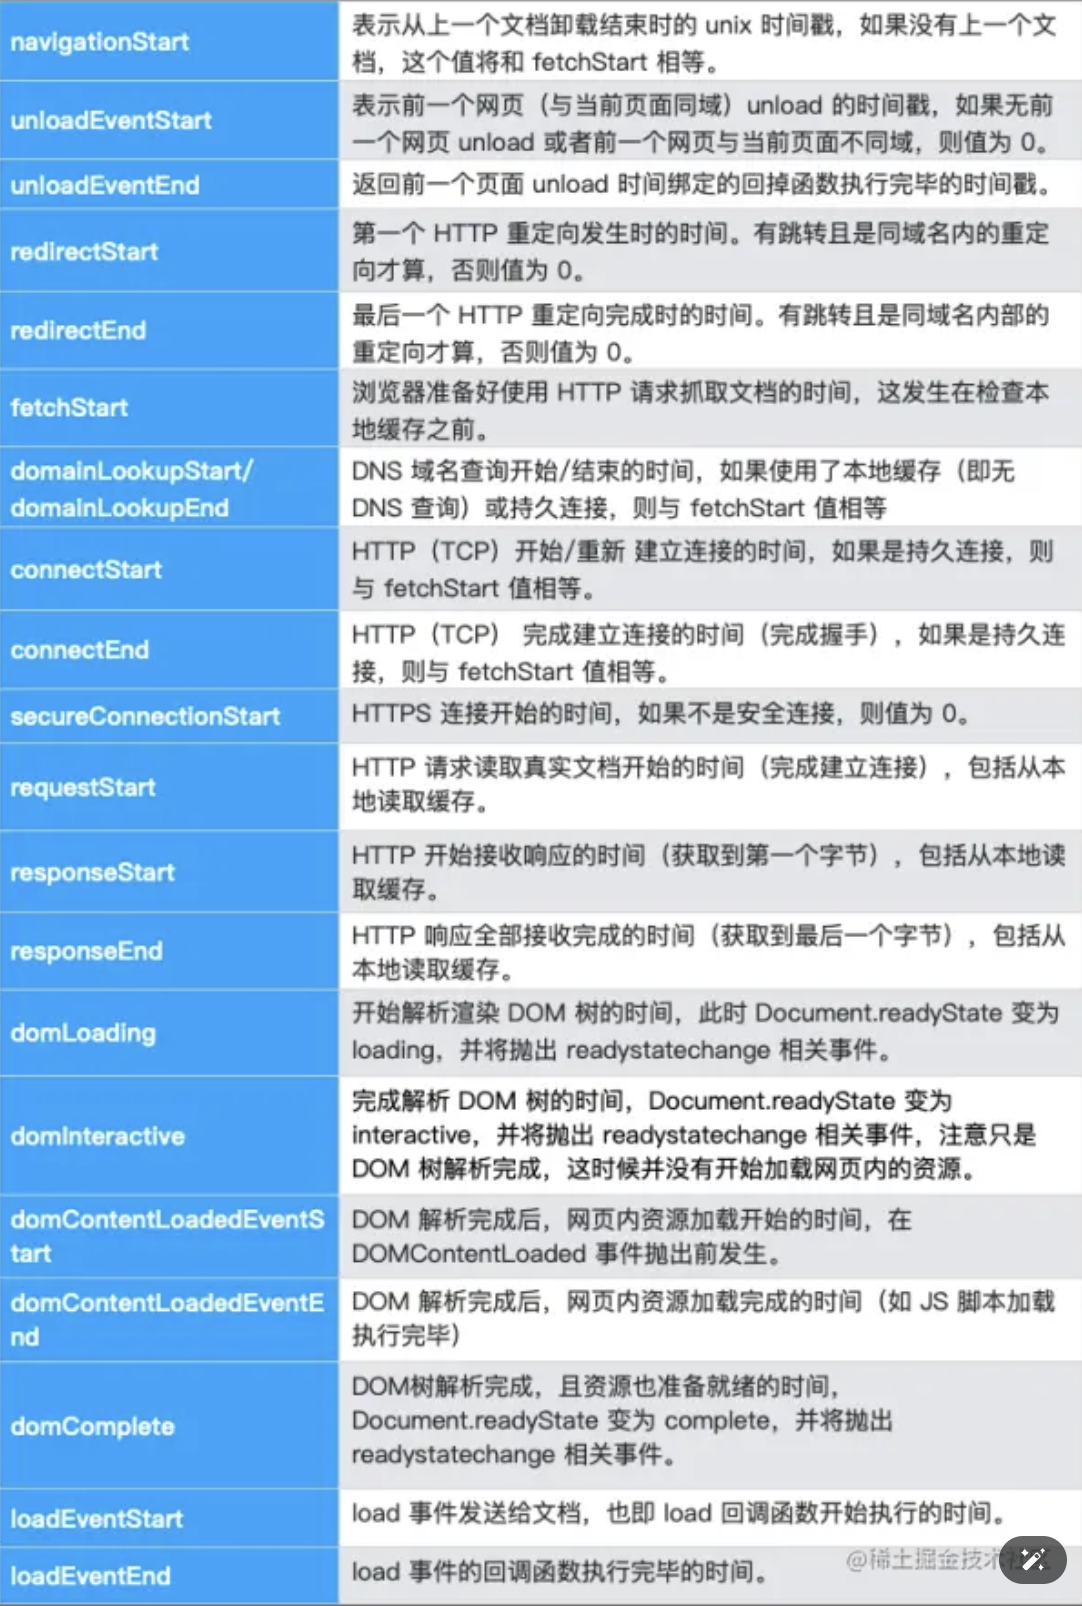
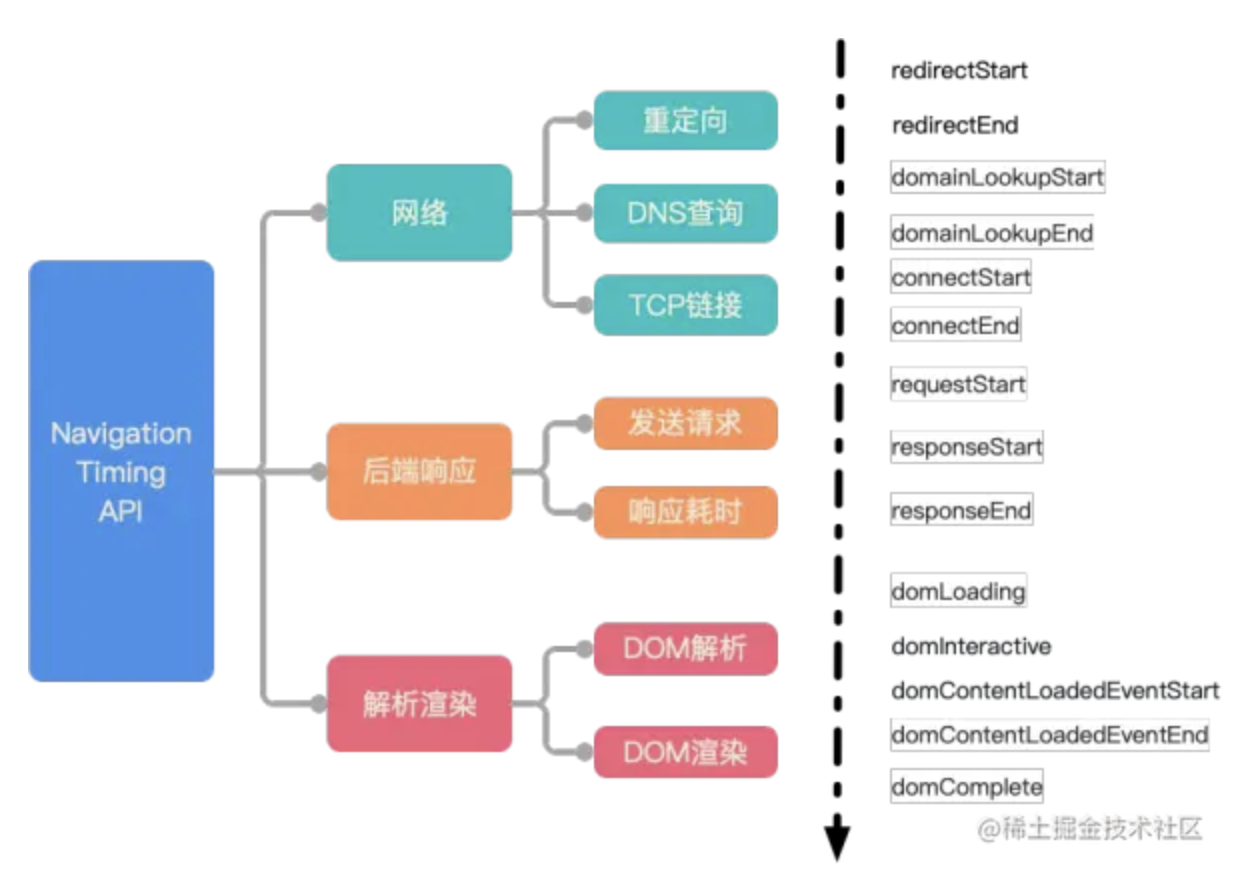
浏览器 API 性能、运行监控 为了帮助开发者更好地衡量和改进前端页面的性能,W3C 性能小组引入了 Navigation Timing API ,实现了自动、精准的页面性能打点,开发者可以通过 window.performance 属性获取:
performance.timing:定义了从 navigationStart 至 loadEventEnd 的 21 个只读属性performance.navigation:定义了当前文档的导航信息,比如是重载还是向前向后performance.memory:内存监控(仅 Chrome)
起始点navigationStart 获取,相当于在 URL 输入栏回车或者页面按 F5 刷新的时间点;另外一个是通过 fetchStart,相当于浏览器准备好使用 HTTP 请求获取文档的时间。
从开发者实际分析使用的场景,浏览器重定向、卸载页面的耗时对页面加载分析并无太大作用;通常建议使用 fetchStart 作为统计起始点。
首字节
白屏时间
相对来说,具备「白屏时间」统计意义的指标,可取 domLoading - fetchStart,此时页面开始解析 DOM 树,页面渲染的第一个元素会很快出现。从 Navigation Timing Level 2 的方案设计,可以直接采用 domInteractive - fetchStart ,此时页面资源加载完成即将进入渲染环节。
首屏时间
具备一定意义上的指标可以使用 domContentLoadedEventEnd - fetchStart,甚至使用 loadEventStart - fetchStart,此时页面 DOM 树已经解析完成并且显示内容。
统计页面性能指标的方法:
1 2 3 4 5 6 7 8 9 10 11 12 13 14 15 16 17 18 19 20 21 22 23 24 25 26 27 28 29 30 31 32 33 34 35 36 37 38 39 40 41 42 43 44 45 46 47 48 49 50 51 52 53 54 55 56 57 58 59 60 61 62 63 64 65 66 67 68 69 70 71 72 73 74 75 76 77 78 79 80 81 82 83 84 85 86 87 88 89 90 91 92 93 94 95 96 97 98 99 100 101 102 103 104 105 106 107 108 109 110 111 112 113 114 115 116 117 118 119 120 121 122 123 124 125 126 127 128 function sendData (data ) console .log("我才不要每次都触发呢" , data);setTimeout (() => {10000 );window .addEventListener("load" , function (const [performanceData] = performance.getEntriesByType("navigation" );let pageLoadTime = performanceData.loadEventEnd - performanceData.domComplete;const requestResponseTime =let dnsLookupTime =let tcpConnectTime =const redirectTime =const ttfbTime =const appcacheTime =const unloadTime =const reqTime = performanceData.responseEnd - performanceData.responseStart;const analysisTime =const blankTime =const domReadyTime =let fcpTime = 0 ;const [fcpEntry] = performance.getEntriesByName("first-contentful-paint" );if (fcpEntry) {let lcpTime = 0 ;const lcpEntries = performance.getEntriesByType("largest-contentful-paint" );if (lcpEntries.length > 0 ) {1 ].renderTime ||1 ].loadTime;const paintMetrics = performance.getEntriesByType("paint" );(metric ) => {console .log(metric.name + ": " + metric.startTime + "ms" );let tti = 0 ;let tbt = 0 ;const observer = new PerformanceObserver((entryList ) => {for (const entry of entryList.getEntries()) {if (entry.duration > 50 ) {50 ;if (tti === 0 && tbt < 50 ) {entryTypes : ["longtask" ] });let perfData = {type : "performance" ,
performance.getEntriesByType("navigation") 等同于 window.performance.timing,并且这里获取到的 performanceData 主要用于测量浏览器加载 HTML 文档所需的时间,而如果是 performance.getEntriesByType("resource") 值的是获取资源(css,脚本,图片等)的时间。
Navigation Timing API 可以监控大部分前端页面的性能。但是随着 SPA 模式的盛行以及框架的普及,页面内容渲染的时机改变了,W3C 标准无法完全满足监控意义。通过 window.performance.timing 所获的的页面渲染所相关的数据,在 SPA 应用中改变了 url 但是不刷新页面的情况下是不会更新的。因此仅仅通过该 API 是无法获得每一个子路由所对应页面的渲染时间。如果需要上报切换路由情况下每一个子页面重新 render 的时间,需要自定义上报。
幸运的是目前 W3C 关于首屏统计已经进入了提议阶段,以 Chrome 为首的浏览器正在打造更能代表用户使用体验的 FP、FCP、FMP 指标,并且逐步开放 API,如谷歌的 web-vitals
异常监控 1 2 3 4 5 6 7 8 9 10 11 12 13 14 15 16 17 18 19 20 21 22 23 24 25 26 27 28 29 30 31 32 33 34 35 36 function sendData (data ) console .log("我才不要每次都触发呢" , data);setTimeout (() => {10000 );window .addEventListener("error" , function (event ) let message = event.message;let filename = event.filename;let lineno = event.lineno;let colno = event.colno;let data = {type : "error" ,message : message,filename : filename,lineno : lineno,colno : colno,
资源监控 1 2 3 4 5 6 7 8 9 10 11 12 13 14 15 16 17 18 19 20 21 22 23 24 25 26 27 28 29 30 31 32 33 34 35 36 37 38 39 40 41 42 43 44 45 46 47 48 49 50 51 52 53 54 55 56 57 58 59 60 61 62 63 64 65 66 67 68 69 70 71 72 73 function sendData (data ) console .log("我才不要每次都触发呢" , data);window .addEventListener("load" , function (let resourceData = performance.getEntriesByType("resource" );function (resource ) let name = resource.name;let type = resource.initiatorType;let size = resource.transferSize;console .log(`== 资源 [${i} ] - ${resource.name} ` );let t = resource.redirectEnd - resource.redirectStart;console .log(`… 重定向时间 = ${t} ` );console .log(`… DNS查询时间 = ${t} ` );console .log(`… TCP握手时间 = ${t} ` );console .log(`… 响应时间 = ${t} ` );0 "0" ;console .log(`… 获取直到响应结束时间 = ${t} ` );0 "0" ;console .log(`… 请求开始直到响应结束时间 = ${t} ` );0 ? resource.responseEnd - resource.startTime : "0" ;console .log(`… 开始直到响应结束时间 = ${t} ` );let resData = {type : "resource" ,name : name,resourceType : type,size : size,
数据上报 测量好时间后,需要将数据发送给服务端。页面性能统计数据对丢失率要求比较低,且性能统计应该在尽量不影响主流程的逻辑和页面性能的前提下进行。
方式
是否异步
页面关闭时是否可靠
是否阻塞主线程
常见问题
fetch()✅
❌ 可能丢失
✅
页面关闭时中断
<img src> 打点✅
⚠️ 不完全可靠
✅
容易被拦截
sendBeacon()✅
✅ 最可靠
❌ 不阻塞
推荐用于监控
上报方式 当浏览器支持 sendBeacon 方法,优先使用该方法,其次使用 img 标签请求降级上报。
sendBeacon 大部分现代浏览器都支持 navigator.sendBeacon 方法,可以用来发送一些统计和诊断的小量数据,特别适合上报统计、监控数据、日志、埋点的场景。有如下优点:
数据可靠,浏览器关闭请求也照样能发,无需保持连接(自动后台发送)
异步且不会阻塞页面卸载(比如用户关闭页面、跳转时依然能发送),不会影响下一页面的加载
不影响性能(浏览器会在空闲时发送)
默认使用 POST 请求
API 使用简单
使用方法:
1 navigator.sendBeacon(url, data);
url:要上报的接口地址(通常是后端收集日志的 API)
data:要上报的数据(可以是 Blob、FormData、URLSearchParams、或 string)
返回值:true 表示已加入发送队列(不保证服务器收到),false 表示发送失败。
使用实例:
1
2
3
4
5
6
7
8
9
10
11
12
13
14
15
16
17
18
19
20
21
22
23
function reportPerformance (data ) const url = "https://monitor.example.com/report" ;const body = JSON .stringify({type : "performance" ,time : Date .now(),metrics : data,window .addEventListener("unload" , () => {const metrics = {lcp : 2.3 ,fid : 50 ,cls : 0.01 ,
实践建议:
数据量小于 64KB(浏览器限制,超过可能失败)
POST JSON 字符串即可,不需设置额外 header
不适合返回结果(它不能拿到响应)
页面卸载时配合 visibilitychange 事件(比 unload 更可靠,现代浏览器推荐用 visibilitychange)1 2 3 4 5 window .addEventListener("visibilitychange" , () => {if (document .visibilityState === "hidden" ) {"/report" , JSON .stringify(data));
img 标签打点
不存在 AJAX 跨域问题,可做跨源的请求
很古老的标签,没有浏览器兼容性问题
1 2 3 4 5 6 7 8 9 10 var i = new Image();function (null ;
上报策略
批量上报(减少请求数)
异步,对性能无影响
离线缓存(localStorage / IndexedDB,网络恢复再上报)
存储分析
后端存储日志(如 ELK、ClickHouse、InfluxDB)
监控平台(Grafana、Datadog、Prometheus、自建大屏)
指标对比
各版本之间(是否优化成功)
不同地区、不同设备、不同网络的对比
用户分层(高价值用户 vs 普通用户)
报警机制
阈值报警(比如 LCP > 4s 占比超过 20%)
趋势报警(性能逐渐变差)
错误率报警(API、JS 错误飙升)